Tuesday, March 6, 2012


Monday, March 5, 2012
Eurozone Services and Composite PMI Back in Contraction; Italy, Spain, France at New Lows
Eurozone Services and Composite PMI Back in Contraction; Italy, Spain, France at New Lows
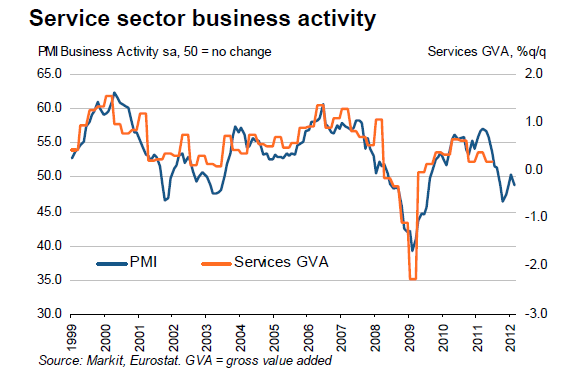
Markit Eurozone Services and Composite PMIs show renewed contraction due to drop in services activity, making it extremely difficult to deny that Europe is in a recession. Let's take a look at some numbers.
Markit Eurozone Composite PMI®
Note that prices received fell for the fifth month in six, but prices paid rose for the twenty-seventh straight month.
Let's take a look at the second biggest economy, France, to see what is coming up.
Markit Eurozone Composite PMI®
The Markit Eurozone PMI® Composite Output Index fell from 50.4 in January to 49.3 in February, dropping below the earlier flash estimate of 49.7. The final reading confirmed that business activity contracted in February, having briefly returned to growth in January following four months of decline at the end of last year.Markit Eurozone Services PMI®
Key points:
- Final data confirm slide back into contraction, as drop in services activity offsets marginal rise in manufacturing output
- Strong downturns still evident in Italy and Spain
- Employment and prices charged fall as firms seek to cut costs and win new sales


Service sector weakness poses new recession riskProfit Squeeze
Key points:
- Service sector activity contracts for fifth time in six months
- Ongoing fall in new business leads to job losses
- Growth in Germany contrasts with steeper declines in Italy and Spain
- Business confidence hits seven-month high
Of the four largest euro countries, only Germany showed expansion in February, and the rate of growth slowed from January’s seven-month high. The French service sector stagnated, ending a two-month period of mild expansion. Both Spain and Italy registered steep contractions, with the rates of decline gathering momentum in both cases.
Nations ranked by business activity (February)
- Ireland 53.3 12-month high
- Germany 52.8 2-month low
- France 50.0 3-month low
- Italy 44.1 4-month low
- Spain 41.9 3-month low
Spanish service providers reported a further particularly steep drop in payroll numbers, and employment also fell sharply in Italy’s service sector. French headcounts rose only slightly, while services employment growth in Germany slowed to the weakest since June 2010.
Companies frequently sought to boost sales by cutting prices, and average prices charged for services fell for the fifth time in the past six months as a result. Price trends varied markedly by country, however, ranging from ongoing upward pressure in Germany to steep falls in Spain and, to a lesser extent, Italy. France registered a slight fall in prices charged for services, reflecting the stagnation of new business flows in February.
In contrast to the trend for charges levied by service providers, input prices in the sector rose for the twenty-seventh straight month, pushed up in many instances by higher fuel and energy prices.
Note that prices received fell for the fifth month in six, but prices paid rose for the twenty-seventh straight month.
Let's take a look at the second biggest economy, France, to see what is coming up.
3 Charts On The US Consumption Crash Dead-Ahead
3 Charts On The US Consumption Crash Dead-Ahead

Average US gas prices are over 13% higher since late December 2011, back at June 2011 levels, and do not look set to drop any time soon. The anecdotal impact of this rise in a significant segment of the real US consumer's spending habits is unmistakable, as we discussed earlier, but it is more important to note where we have come from when considering the macro impact. Q4 macro data was 'juiced' by the significant drop in the price of energy as the 4-5pt drop in Energy-and-Utilities spend enabled 'visible' consumption to rise during that time (obviously helped by government handouts also). Just as occurred in the latter part of 2008, as the consumer was forced to spend more on Energy, so the visible consumption dropped notably and given the significance of the current data 'drop' in energy spending, when the current gas prices filter into this data, we would expect, as Credit Suisse points out, consumption on more discretionary spending will drop significantly.
Gas prices are up very significantly (both absolutely and on average)...

but the 'forced' rise in Energy spending has not filtered into the data yet...

...and just as in late 2008, as the spend of Energy and Utilities rises, so discretionary spending will drop significantly and given the huge divergence in the last quarter or two, the reaction could be very significant.

Perhaps this is just the 'crash' that Bernanke needs to run-the-presses again as conditionality will increasingly force investors to reject the 'optimal' buy-and-keep-buying trend as they recognize that QE3 can't start until things get worse, and buying in anticipation of QE3 means it will never happen?
Charts: Bloomberg
Gas prices are up very significantly (both absolutely and on average)...

but the 'forced' rise in Energy spending has not filtered into the data yet...

...and just as in late 2008, as the spend of Energy and Utilities rises, so discretionary spending will drop significantly and given the huge divergence in the last quarter or two, the reaction could be very significant.

Perhaps this is just the 'crash' that Bernanke needs to run-the-presses again as conditionality will increasingly force investors to reject the 'optimal' buy-and-keep-buying trend as they recognize that QE3 can't start until things get worse, and buying in anticipation of QE3 means it will never happen?
Charts: Bloomberg
Thursday, March 1, 2012
2/29/12 Sen. Snowe: We can't even do regular business
http://www.cbsnews.com/8301-18563_162-57388130/sen-snowe-we-cant-even-do-regular-business/
Sen Snowe: has decided to resign from Congress. The link above is to a CBS news video and Snowe gives her reasons for her resignation. A disturbing and informative interview on the inner workings of the political system that continues to fail.
Sen Snowe: has decided to resign from Congress. The link above is to a CBS news video and Snowe gives her reasons for her resignation. A disturbing and informative interview on the inner workings of the political system that continues to fail.
Tuesday, February 21, 2012
Market Update 02/21/12

Submitted by: Francis Soyer
Hi folks!,
It has been a while since I have written. The truth of the matter is there is not a heck of alot to talk about. Yes the ECB continues to kick the can down the road with one BS bailout plan after another with no real cure of realistic plan for a way for Greece to stay in the ECB.
Other than that we have day after day of Fed Pomo with no volume participation in the market from either institutional investors or non pro and retail whatsoever. Therefore the Fed is in the drivers seat and a drift up stairstep style that began in late December has continued un abated. That said I think it reasonable to expect the same for as long as a few weeks from now where we may see a turning point in the market. Until then an uptick to break up the boredom.
Thursday, January 26, 2012
And The Winner Is...Gold
Original Article Here:
Year-to-date, Gold is up an impressive 9.4%, significantly outpacing the S&P 500 at +5.6% and the disappointing 2% loss (in price) for the 30Y bond.
Treasuries sold back off initial knee-jerk rally low yields into the close but the EUR kept going (holding above 1.3100) as Gold and Silver were the big winners on the day (+2.9% and 3.4% on the week now). Stocks and credit roared higher after an initial stumble post FOMC. Financials lagged among all the S&P sectors (and Utilities outperformed post FOMC statement +0.75% vs financials -0.25%). Right up until the close, credit and equity markets were on a tear but very soon after cash closed, futures limped back and HY credit snapped lower (quite dramatically) which makes some sense given just how ridiculously rich it had become to fair-value.

Gold handily outperforming this year.

After HYG signaled an early turn lower in credit and equities, the FOMC statement sent risk on a rip which didn't want to stop until it had taken out recent highs. Average trade size increased significantly once we got over recent swing highs and as is clear we leaked back into the close with quite a significant drop in HY as cash markets closed. The suspicion would be that CDS index levels were just being reracked by market-makers instead of heavy flow driving it up and then some real orders hit as we rolled over and the market hit a small void. We note that IG and HY are now at almost record levels of richness to their intrinsic value (and the 3s5s curves continue to flatten - bearishly in our view).

Commodities, as one might expect, enjoyed the limelight in what was on first glance a disappointing statement lacking any QE-specific expectations and ZIRP moves (it didn't seem that surprising to us). But the squeeze was obviously on in stocks and the reality that the only way the Fed has left to combat the ills of reality is to print drove Gold up to six-week highs over $1710.

Treasuries ripped and then dipped with 30Y ending up back near its high yields and the rest of the curve well off its low yields by the close.

Broadly speaking risk assets moved in a supportive manner for stocks (as is clear from the capital structure - left, and CONTEXT - right).
Charts: Bloomberg and Capital Context
Year-to-date, Gold is up an impressive 9.4%, significantly outpacing the S&P 500 at +5.6% and the disappointing 2% loss (in price) for the 30Y bond.
Treasuries sold back off initial knee-jerk rally low yields into the close but the EUR kept going (holding above 1.3100) as Gold and Silver were the big winners on the day (+2.9% and 3.4% on the week now). Stocks and credit roared higher after an initial stumble post FOMC. Financials lagged among all the S&P sectors (and Utilities outperformed post FOMC statement +0.75% vs financials -0.25%). Right up until the close, credit and equity markets were on a tear but very soon after cash closed, futures limped back and HY credit snapped lower (quite dramatically) which makes some sense given just how ridiculously rich it had become to fair-value.

Gold handily outperforming this year.

After HYG signaled an early turn lower in credit and equities, the FOMC statement sent risk on a rip which didn't want to stop until it had taken out recent highs. Average trade size increased significantly once we got over recent swing highs and as is clear we leaked back into the close with quite a significant drop in HY as cash markets closed. The suspicion would be that CDS index levels were just being reracked by market-makers instead of heavy flow driving it up and then some real orders hit as we rolled over and the market hit a small void. We note that IG and HY are now at almost record levels of richness to their intrinsic value (and the 3s5s curves continue to flatten - bearishly in our view).

Commodities, as one might expect, enjoyed the limelight in what was on first glance a disappointing statement lacking any QE-specific expectations and ZIRP moves (it didn't seem that surprising to us). But the squeeze was obviously on in stocks and the reality that the only way the Fed has left to combat the ills of reality is to print drove Gold up to six-week highs over $1710.

Treasuries ripped and then dipped with 30Y ending up back near its high yields and the rest of the curve well off its low yields by the close.

Broadly speaking risk assets moved in a supportive manner for stocks (as is clear from the capital structure - left, and CONTEXT - right).
Charts: Bloomberg and Capital Context
Tuesday, January 10, 2012
Market Update 01/10/12 and 2012 Look Ahead

Submitted by: Francis Soyer
This morning earnings season for 4Q 2011 begins. The key to this quarters reports will be the tone of managements look ahead for 2012 and so I will be watching with a critical focus on what companies are seeing in their pipelines. While management by design is usually bullish as they are required to be, the below charts from this mornings Zero Hedge report lays out some fairly grim charts as far as macro econ is concerned.


Subscribe to:
Posts (Atom)